- MEG Help Center
- FAQs
- Dashboard Reports
-
How to Videos
-
Audits & Surveys
-
Dashboard
-
Risk Management / Incident Reporting
-
Document Management
-
eGuides
-
FAQs
-
About Us
-
Stay up to date with MEG!
-
Account Management
-
App Functionality and Usage
-
Audit and Data Management
-
Technical Support and Troubleshooting
-
Customization and Configuration
-
Integration and Data Storage
-
Top Ten Questions
Types of Dashboard Reports
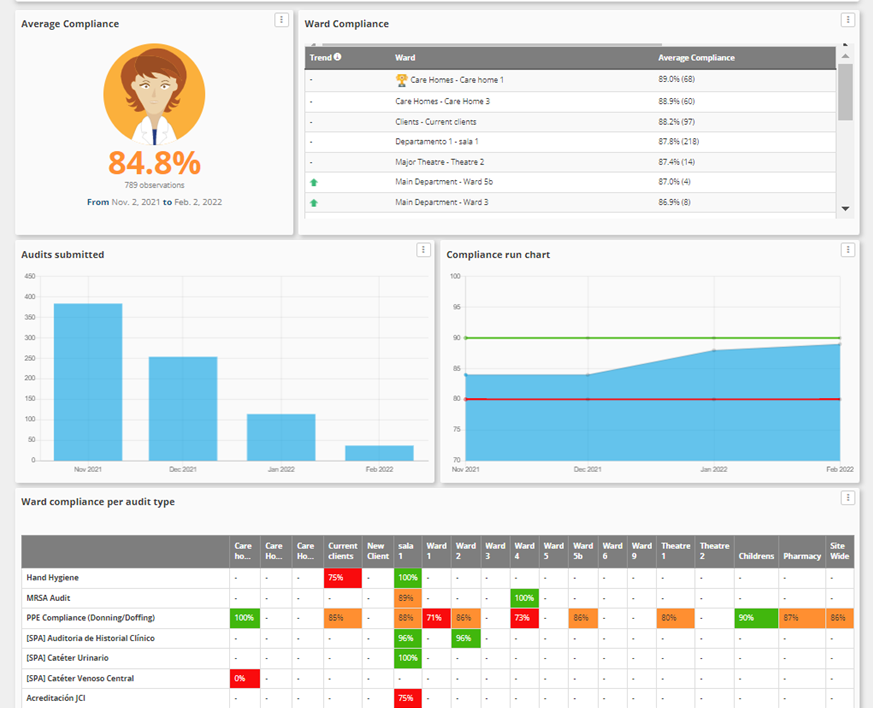
There are various graphs and tables giving a wide range of information relating to your data
Some audits require more detailed tables and graphs but most of the graphs outline:
- Overall scores
- Scoring of the audits by ward/area/wing
- Scoring of the audits by subform (if applicable)
- Forms completed by month
- Compliance run chart


-1.png?height=120&name=MEG%20high%20res%20strap_logo%20(trans)-1.png)